Lab 07 · The 4-Container Pod & Central Observability Pipeline
Core Lesson: Upgrade your reusable Tier-2 Helm chart (
acme-microservice) so every domain pod runs 4 containers (app+istio-proxy+fluent-bit+otel-collector), prove all three enterprise telemetry patterns (stdout, sharedemptyDirfile-tailing, and loopback OTLP), and solve thesubPathmount + Default-Deny Egress traps.
GCP Twin: Phase P6 & P7a (google_logging_project_bucket_config.central,google_logging_project_sink.domains,stackdriver&googlecloudexporters).
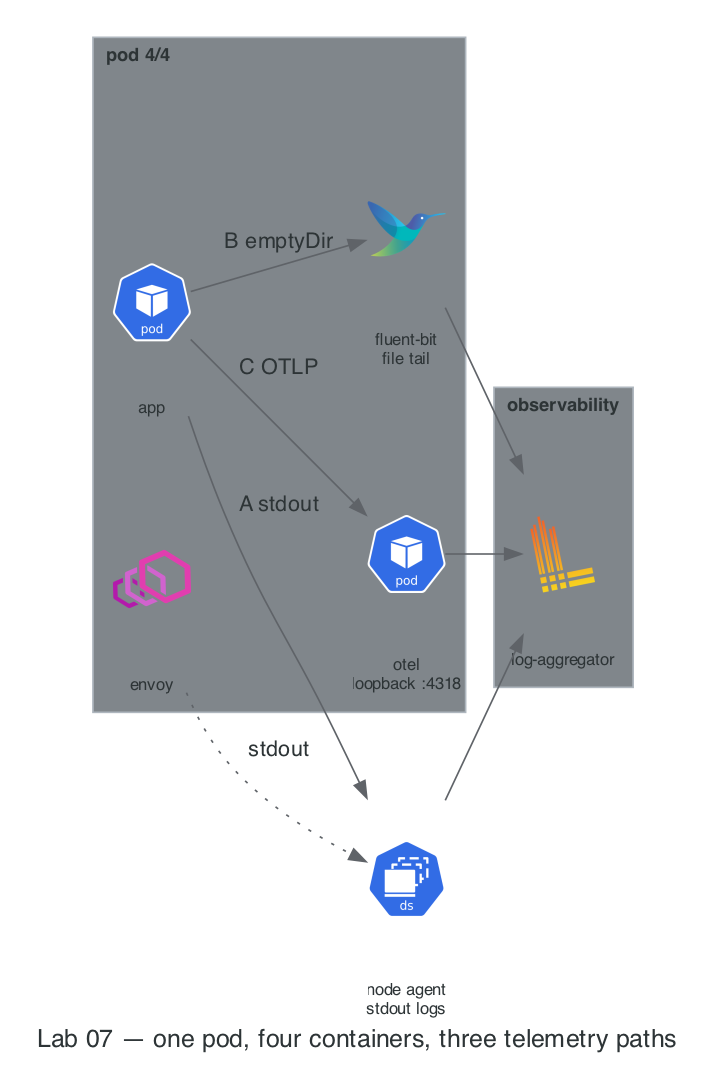
1. Architecture Decision: Why Do Enterprises Use 3 Telemetry Paths?
| Nuance | What Happens If You Get It Wrong |
|---|---|
subPath: fluent-bit.conf on ConfigMap Volume Mounts |
Inside fluent/fluent-bit:3.2, /fluent-bit/etc/ already contains parsers.conf. If you mount a ConfigMap onto /fluent-bit/etc without subPath, Kubernetes hides the entire directory, deleting parsers.conf and crashing the pod! |
| Sidecar Resource Multiplication Tax | Adding 3 sidecars per pod (istio-proxy 50m/96Mi + otel-collector 50m/64Mi + fluent-bit 25m/32Mi) adds 125m CPU and 192Mi RAM to every single replica. Always calculate node allocatable capacity before enabling sidecars cluster-wide. |
Sidecars Share the Pod's Network Namespace & NetworkPolicy |
Loopback calls (app -> 127.0.0.1:4318 otel-collector) never leave the pod and need no NetworkPolicy. Calling log-aggregator.observability:24224 leaves the pod and is blocked by default-deny egress until explicitly allowed! |
2. Step-by-Step Hands-On Build
Step 1: Deploy the Central Log Aggregator in observability (Cloud Logging Bucket Twin)
kubectl apply -f - <<'EOF'
apiVersion: v1
kind: ConfigMap
metadata:
  name: aggregator-config
  namespace: observability
data:
  fluent-bit.conf: |
    [SERVICE]
        Flush        1
        Log_Level    info
    [INPUT]
        Name         forward
        Listen       0.0.0.0
        Port         24224
    [OUTPUT]
        Name         stdout
        Match        *
        Format       json_lines
---
apiVersion: apps/v1
kind: Deployment
metadata:
  name: log-aggregator
  namespace: observability
spec:
  replicas: 1
  selector:
    matchLabels:
      app: log-aggregator
  template:
    metadata:
      labels:
        app: log-aggregator
    spec:
      containers:
        - name: fluent-bit
          image: fluent/fluent-bit:3.2
          imagePullPolicy: IfNotPresent
          ports:
            - containerPort: 24224
          volumeMounts:
            - name: cfg
              mountPath: /fluent-bit/etc/fluent-bit.conf
              subPath: fluent-bit.conf
      volumes:
        - name: cfg
          configMap:
            name: aggregator-config
---
apiVersion: v1
kind: Service
metadata:
  name: log-aggregator
  namespace: observability
spec:
  selector:
    app: log-aggregator
  ports:
    - name: tcp-forward
      port: 24224
      targetPort: 24224
EOF

kubectl -n observability rollout status deploy/log-aggregator --timeout=90s
Step 2: Upgrade Your Reusable Helm Chart (charts/acme-microservice) for 4 Containers
Update charts/acme-microservice/templates/all.yaml so setting sidecars.fluentbit.enabled=true and sidecars.otel.enabled=true injects the ConfigMaps, emptyDir volume, and both sidecars:
cat << 'EOF' > ~/acme-k8s-lab/charts/acme-microservice/templates/all.yaml
apiVersion: v1
kind: ServiceAccount
metadata:
  name: {{ .Values.domain }}
  namespace: dom-{{ .Values.domain }}
  {{- if .Values.serviceAccount.gsaEmail }}
  annotations:
    iam.gke.io/gcp-service-account: {{ .Values.serviceAccount.gsaEmail | quote }}
  {{- end }}
---
{{- if .Values.sidecars.fluentbit.enabled }}
apiVersion: v1
kind: ConfigMap
metadata:
  name: {{ .Values.domain }}-fluentbit
  namespace: dom-{{ .Values.domain }}
data:
  fluent-bit.conf: |
    [SERVICE]
        Flush        1
        Parsers_File parsers.conf
    [INPUT]
        Name         tail
        Path         /var/log/app/*.log
         Tag          app.{{ .Values.domain }}
    [FILTER]
        Name         record_modifier
        Match        *
        Record       domain {{ .Values.domain }}
    [OUTPUT]
        Name         forward
        Match        *
        Host         log-aggregator.observability.svc.cluster.local
        Port         24224
---
{{- end }}
{{- if .Values.sidecars.otel.enabled }}
apiVersion: v1
kind: ConfigMap
metadata:
  name: {{ .Values.domain }}-otel
  namespace: dom-{{ .Values.domain }}
data:
  config.yaml: |
    receivers:
      otlp:
        protocols:
          http:
            endpoint: 127.0.0.1:4318
    exporters:
      debug:
        verbosity: basic
    service:
      pipelines:
        traces:
          receivers: [otlp]
          exporters: [debug]
---
{{- end }}
apiVersion: v1
kind: Service
metadata:
  name: {{ .Values.domain }}
  namespace: dom-{{ .Values.domain }}
  labels:
    app: {{ .Values.domain }}
    domain: {{ .Values.domain }}
spec:
  selector:
    app: {{ .Values.domain }}
  ports:
    - name: http
      port: {{ .Values.service.port }}
      targetPort: {{ .Values.service.targetPort }}
---
apiVersion: apps/v1
kind: Deployment
metadata:
  name: {{ .Values.domain }}
  namespace: dom-{{ .Values.domain }}
spec:
  replicas: {{ .Values.replicas }}
  selector:
    matchLabels:
      app: {{ .Values.domain }}
  template:
    metadata:
      labels:
        app: {{ .Values.domain }}
        domain: {{ .Values.domain }}
    spec:
      serviceAccountName: {{ .Values.domain }}
      volumes:
        - name: applogs
          emptyDir: {}
        {{- if .Values.sidecars.fluentbit.enabled }}
        - name: fb-cfg
          configMap:
            name: {{ .Values.domain }}-fluentbit
        {{- end }}
        {{- if .Values.sidecars.otel.enabled }}
        - name: otel-cfg
          configMap:
            name: {{ .Values.domain }}-otel
        {{- end }}
      containers:
        - name: app
          image: "{{ .Values.image.repository }}:{{ .Values.image.tag }}"
          imagePullPolicy: {{ .Values.image.pullPolicy }}
          ports:
            - containerPort: {{ .Values.service.targetPort }}
          {{- if .Values.env }}
          env:
            {{- range $k, $v := .Values.env }}
            - name: {{ $k }}
              value: {{ $v | quote }}
            {{- end }}
          {{- end }}
          {{- if .Values.envFromSecrets }}
          envFrom:
            {{- range .Values.envFromSecrets }}
            - secretRef:
                name: {{ . }}
            {{- end }}
          {{- end }}
          {{- if .Values.probes.readiness.enabled }}
          readinessProbe:
            httpGet:
              path: {{ .Values.probes.readiness.path }}
              port: {{ .Values.service.targetPort }}
            initialDelaySeconds: 3
            periodSeconds: 5
          {{- end }}
          # Telemetry generator: heartbeat JSON line -> /var/log/app/app.log (Pattern B file-tail)
          # and a synthetic OTLP span -> 127.0.0.1:4318 (Pattern C) every 5s.
          # (Real saga events — "order confirmed", "payment declined" — also stream via stdout, Pattern A.)
          lifecycle:
            postStart:
              exec:
                command:
                  - /bin/sh
                  - -c
                  - |
                    touch /var/log/app/app.log
                    (while true; do
                      echo "{\"severity\":\"INFO\",\"domain\":\"{{ .Values.domain }}\",\"message\":\"heartbeat\"}" >> /var/log/app/app.log
                      wget -qO /dev/null --header="Content-Type: application/json" \
                        --post-data='{"resourceSpans":[{"resource":{"attributes":[{"key":"service.name","value":{"stringValue":"{{ .Values.domain }}"}}]},"scopeSpans":[{"spans":[{"traceId":"5B8EFFF798038103D269B633813FC60C","spanId":"EEE19B7EC3C1B174","name":"heartbeat","startTimeUnixNano":"1700000000000000000","endTimeUnixNano":"1700000001000000000","kind":1}]}]}]}' \
                        http://127.0.0.1:4318/v1/traces 2>/dev/null || true
                      sleep 5
                    done) &
          volumeMounts:
            - name: applogs
              mountPath: /var/log/app
          resources:
            {{- toYaml .Values.resources | nindent 12 }}
        {{- if .Values.sidecars.fluentbit.enabled }}
        - name: fluent-bit
          image: {{ .Values.sidecars.fluentbit.image }}
          imagePullPolicy: IfNotPresent
          volumeMounts:
            - name: applogs
              mountPath: /var/log/app
              readOnly: true
            - name: fb-cfg
              mountPath: /fluent-bit/etc/fluent-bit.conf
              subPath: fluent-bit.conf
          resources:
            requests:
              cpu: 25m
              memory: 32Mi
            limits:
              memory: 64Mi
        {{- end }}
        {{- if .Values.sidecars.otel.enabled }}
        - name: otel-collector
          image: {{ .Values.sidecars.otel.image }}
          imagePullPolicy: IfNotPresent
          args: ["--config=/conf/config.yaml"]
          volumeMounts:
            - name: otel-cfg
              mountPath: /conf
          resources:
            requests:
              cpu: 50m
              memory: 64Mi
            limits:
              memory: 128Mi
        {{- end }}
EOF

helm lint ~/acme-k8s-lab/charts/acme-microservice
Step 3: Upgrade All 3 Domains with Sidecars Enabled (4/4 Ready)
for d in orders payments inventory; do
  helm upgrade --install "$d" ~/acme-k8s-lab/charts/acme-microservice \
    --namespace "dom-$d" \
    --set domain="$d" \
    --set sidecars.fluentbit.enabled=true \
    --set sidecars.otel.enabled=true
done

# Wait for rollout and verify all 4 containers are inside each pod!
for d in orders payments inventory; do
  kubectl -n "dom-$d" rollout status "deploy/$d" --timeout=120s
  echo "=== Containers in dom-$d ==="
  kubectl -n "dom-$d" get pod -l "app=$d" -o jsonpath='{.items[0].spec.containers[*].name}{"\n"}'
done
Expected Output: app fluent-bit otel-collector istio-proxy (4/4 Ready).
Step 4: Diagnose & Fix Break #2 — Central Aggregator Receives Zero Logs!
Check the central log-aggregator logs right now, and check fluent-bit inside dom-orders:
kubectl -n observability logs deploy/log-aggregator --tail=10
kubectl -n dom-orders logs deploy/orders -c fluent-bit --tail=5
Why is fluent-bit failing to connect to log-aggregator.observability:24224?
Because default-deny Egress in dom-orders, dom-payments, and dom-inventory blocks TCP 24224 to observability! Open the Egress hole in all 3 domains:
for ns in dom-orders dom-payments dom-inventory; do
kubectl apply -f - <<EOF
apiVersion: networking.k8s.io/v1
kind: NetworkPolicy
metadata:
  name: allow-to-observability
  namespace: $ns
spec:
  podSelector: {}
  policyTypes:
    - Egress
  egress:
    - to:
        - namespaceSelector:
            matchLabels:
              kubernetes.io/metadata.name: observability
      ports:
        - protocol: TCP
          port: 24224
EOF
done
Step 5: Verify All 3 Telemetry Streams Live — on Real Saga Events
# 1. Generate real events: one confirmed order + one declined (GIZMO-3 = 99.99)
kubectl -n dom-orders exec deploy/orders -c app -- \
  wget -qO- --post-data='{"item_id":1,"qty":1}' --header='Content-Type: application/json' http://localhost:8080/orders
kubectl -n dom-orders exec deploy/orders -c app -- \
  wget -qO- --post-data='{"item_id":3,"qty":1}' --header='Content-Type: application/json' http://localhost:8080/orders || true

# 2. Pattern A: Node stdout logs — real business events now, not nginx hits
kubectl -n dom-orders   logs deploy/orders   -c app --tail=5   # "order confirmed", "payment declined, compensating", "stock restored"
kubectl -n dom-payments logs deploy/payments -c app --tail=3   # "payment confirmed" / "payment declined"
kubectl -n dom-payments logs deploy/payments -c istio-proxy --tail=3   # Envoy JSON access log (mTLS traffic)

# 3. Pattern B: File-Tail Sidecar -> Central Log Aggregator (Filtered by domain!)
kubectl -n observability logs deploy/log-aggregator --tail=10

# 4. Pattern C: Loopback OTLP -> OTel Collector Sidecar
kubectl -n dom-orders logs deploy/orders -c otel-collector --tail=10
Correlation exercise: on GCP this same trio (
order_idin every log line) is what lets Cloud Logging + Trace stitch a single order across three services and two databases. Grep the aggregator for yourorder_id— that IS the observability story.
3. Readiness Gate G-07
- Which of the 3 telemetry paths (
stdout,fluent-bitfile-tail,otel-collectorOTLP) works even if the pod'sNetworkPolicyblocks all egress, and why? (stdout→ Node Kubelet writes/var/log/containerson the host filesystem, and the node-level logging agent ships it using the Node's network/identity). - Why did
app -> otel-collector(127.0.0.1:4318) work before we addedallow-to-observability, whilefluent-bit -> log-aggregator(24224) failed? (Containers in the same Pod share the loopbacklointerface;NetworkPolicyonly filters traffic entering or leaving the Pod'seth0veth interface).
Next Step: Lab 08 · North-South Entry: MetalLB LoadBalancer & The 4-Layer Ingress Gauntlet →