Module 2: Probability Refresher for AI
Start here: What does "0.576 probability" actually mean?
Picture a traffic light. It doesn't tell you whether an accident will happen — it tells you how much to trust the current flow of traffic before you step on the gas.
Model probabilities work the same way.
When your classifier returns this for the Monday ticket:
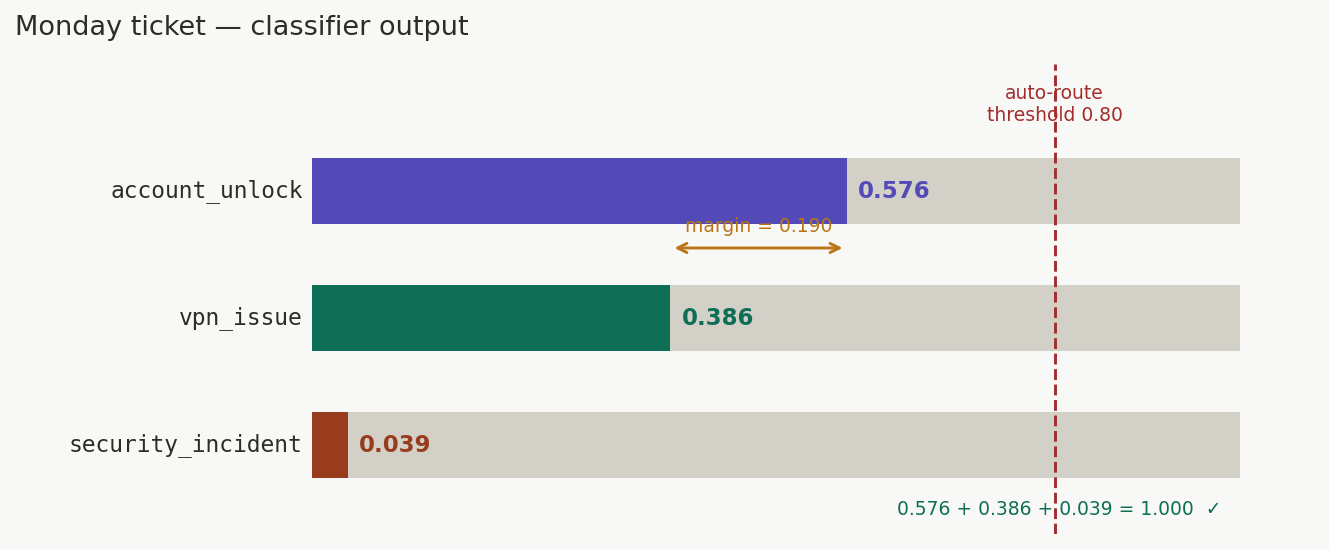
account_unlock:    0.576
vpn_issue:         0.386
security_incident: 0.039
It is not saying: "I am 57.6% sure this is an account unlock."
It is saying: "Given everything I've learned, account_unlock fits the pattern better than the other options — and here's how much better."
The model is expressing relative preference, not absolute truth. That distinction will save you from bad routing decisions.
The two rules that can never break
No matter what model you use, no matter what the ticket says, these two rules must always hold:
In plain English: 1. All probabilities across all classes must add up to exactly 1 (100%) 2. No probability can be negative or greater than 1
Why you should care operationally: If your model outputs [0.576, 0.386, 0.100] — that sums to 1.062, not 1.0. That's a red flag. Either the output wasn't normalized, something broke in post-processing, or you're reading raw logits instead of probabilities. Any downstream routing logic built on that is already wrong.
Quick sanity check to run in every pipeline:
assert abs(sum(probs.values()) - 1.0) < 1e-6, "Probabilities don't sum to 1!"
The formula that answers "how much time will this cost us?"
Once you have valid probabilities, you can calculate expected value — what you should plan for on average across many tickets.
Where \(x_i\) is the cost (in minutes, dollars, headcount) for handling intent \(i\).
Real example: staffing your Monday morning queue
Say your model has classified today's incoming 500 tickets with these probabilities (the same distribution as the Monday ticket):
| Intent | Probability | Avg. Handle Time |
|---|---|---|
account_unlock |
0.576 | 4 min |
vpn_issue |
0.386 | 18 min |
security_incident |
0.039 | 45 min |
These are the canonical Monday ticket probabilities — derived from logits
[3.2, 2.8, 0.5]via softmax (you'll see exactly how in Module 3).
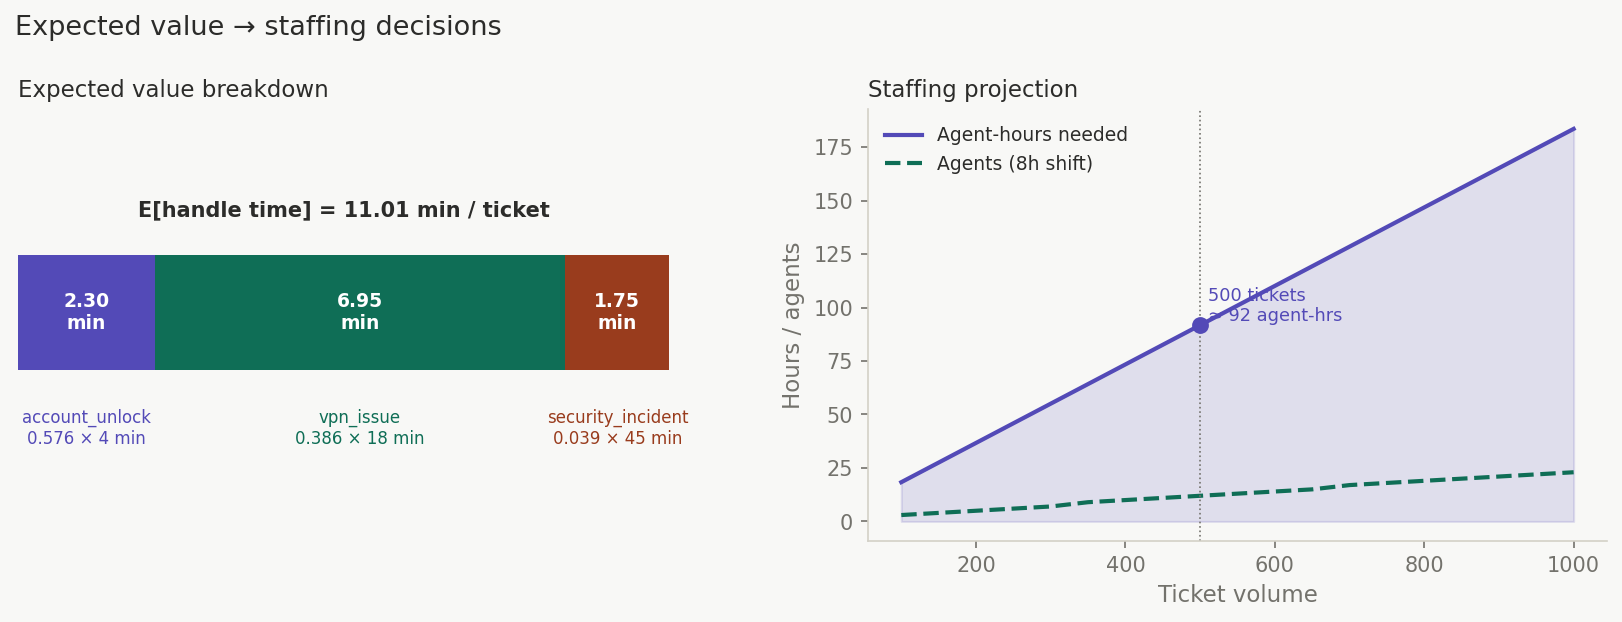
Expected handle time per ticket:
500 tickets × 11.01 min = 5,505 minutes = ~92 agent-hours needed today.
Now you're not guessing at staffing. You're planning from data.
The routing decision: when to act, when to pause
Back to the Monday ticket with these scores:
account_unlock:    0.576  ← top class
vpn_issue:         0.386
security_incident: 0.039
Your policy says: auto-route only if the top class hits 0.80 confidence.
This ticket fails. Here's why that matters:
The gap between account_unlock (0.576) and vpn_issue (0.386) is only 0.190.
That's not decisive — it's uncertain. If you auto-route to account unlock and it's
actually a VPN issue, you've sent the ticket to the wrong team, wasted a handler's
time, and frustrated the user. And if it's actually a security incident, the
consequences are far worse.
The correct response is to route to clarification — ask one confirming question, or send to a human reviewer — before taking action.
Note: You'll see exactly where
[0.576, 0.386, 0.039]comes from in Module 3. For now, treat them as the model's output. Module 3 opens the black box.
The confidence ladder (build this into your system)
| Top class score | What it signals | What to do |
|---|---|---|
| ≥ 0.80 | High confidence | Auto-route to specialist queue |
| 0.60 – 0.79 | Moderate confidence | Route with a flag: "verify before acting" |
| 0.40 – 0.59 | Low confidence | Send to clarification queue |
| < 0.40 | No clear winner | Escalate to human immediately |
The exact thresholds are yours to tune — but the ladder structure is non-negotiable. A system with no middle tier will either over-automate (and make expensive mistakes) or under-automate (and defeat the point).
The trap that catches everyone
"0.82 confidence? That's basically confirmed. Route it."
No. Here's the mental model to replace that instinct:
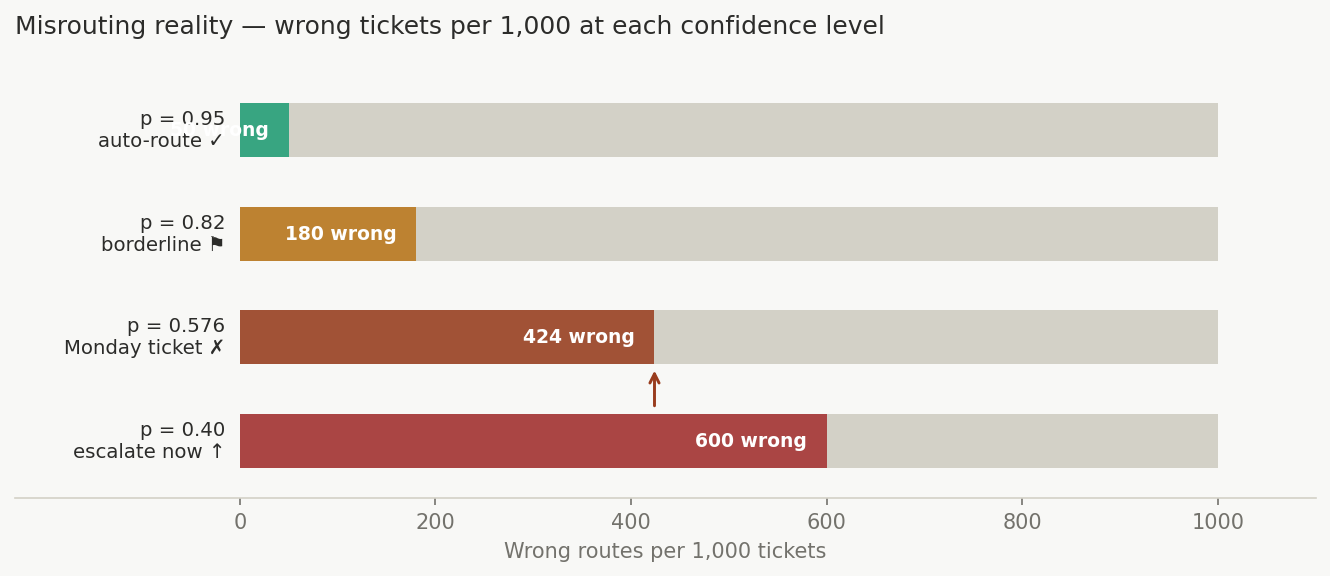
Imagine you flip a weighted coin that lands heads 82% of the time. If you route 1,000 tickets at 0.82 confidence, 180 of them are wrong. At 100 tickets a day, that's 18 misrouted tickets daily — silently, with no error message, no alert, no warning.
Now apply that to your Monday ticket at 0.576. Route 1,000 tickets at that confidence: roughly 424 are wrong. Nearly half. The model told you — through the low score, the thin margin of 0.190, and the ambiguous ticket language — that it wasn't sure. The number is the warning.
This is why you need: 1. A threshold policy — written down, agreed upon, not just in someone's head 2. A fallback behavior — what exactly happens when confidence is too low 3. Monitoring — track whether your model's confidence distribution drifts week-over-week
If your average top-class confidence was 0.78 last month and it's 0.61 this month, something changed. Either your ticket language shifted, or your model needs retraining.
Module 02 — Probability: visualization notes
Four visualizations accompany the Module 02 article. This file describes each one and what it illustrates.
Visual 1 — Classifier output bars
What it shows: The raw classifier output for the Monday ticket as three horizontal bars, proportional to probability. A summary panel below shows the sum check (1.000 ✓), the margin between top and second class (0.190 ⚠), and the auto-route threshold check (0.576 < 0.80 ✗).
Key insight: The thin margin of 0.190 is as important as the top score of 0.576. A wide bar with a narrow lead is not a confident classification.
Visual 2 — Confidence ladder
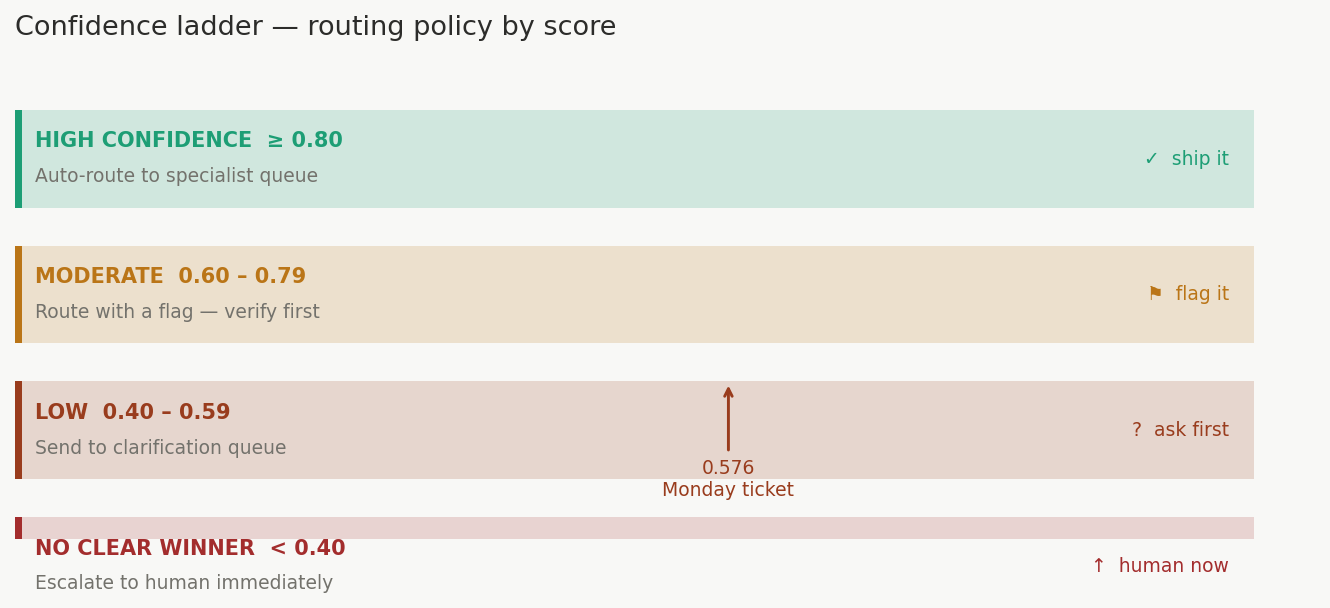
What it shows: Four routing tiers as a vertical stack of colored bands. Each band shows the score range, what it signals, and what action to take. A pointer arrow marks where the Monday ticket (0.576) lands — in the clarification queue band, not auto-route.
Key insight: The ladder makes the routing policy visible. Without it, decisions live in someone's head and vary by analyst. With it, the policy is structural.
| Band | Score | Action |
|---|---|---|
| High confidence | ≥ 0.80 | Auto-route |
| Moderate | 0.60–0.79 | Route with flag |
| Low | 0.40–0.59 | Clarification queue |
| No clear winner | < 0.40 | Escalate immediately |
Visual 3 — Expected value staffing calculator (interactive)
What it shows: An interactive slider for ticket volume. Fixed cards show the three components of the expected value calculation:
Dragging the slider updates: total minutes, agent-hours needed, and agents required for an 8-hour shift.
Key insight: At 500 tickets, 11.01 min/ticket = 5,505 minutes = ~92 agent-hours. You are not guessing at staffing — you are planning from the probability distribution.
Visual 4 — Misrouting reality bars
What it shows: Four horizontal bars representing four confidence levels (0.95, 0.82, 0.576, 0.40). Each bar is sized to show the number of wrong routes per 1,000 tickets at that confidence level.
| Confidence | Wrong per 1,000 | Status |
|---|---|---|
| 0.95 | 50 | Auto-route safe |
| 0.82 | 180 | Borderline — flag |
| 0.576 | 424 | Monday ticket — do not auto-route |
| 0.40 | 600 | Escalate immediately |
Key insight: 0.82 sounds like "basically confirmed." It means 180 wrong tickets per 1,000 — 18 per day at 100 tickets/day, silently, with no error message. The number is the warning.
How to practice this
Open notebooks/math-foundations/02_probability.ipynb and work through:
- Convert raw model scores (logits) into valid probabilities that sum to 1
- Spot deliberately broken outputs — probabilities that violate the two rules
- Calculate expected handle time for a sample Monday queue
- Tune confidence thresholds and watch how your misroute rate changes
What to lock in before moving on
- [ ] Can you explain why 0.576 probability ≠ "57.6% confirmed correct"?
- [ ] Do your pipeline's output probabilities always sum to 1? (add the assert check)
- [ ] Is your threshold policy written down with explicit fallback behavior for each tier?
- [ ] Are ambiguous tickets (0.40–0.60) going somewhere useful, not just silently dropped?
- [ ] Are you tracking confidence distribution drift week to week?