Compiler Flags
Java code compiles to byte code (.class file) which then runs (interpreted at runtime) in JVM.
- Write Java code once and run it on any hardware consistently.
- For C language, the code is directly compiled to each native machine code
Experiment with New features
experiment with continuations with J21 with VM Argument
--add-exports=java.base/jdk.internal.vm=ALL-UNNAMED
For Gradle based projects, add in build.gradle
tasks.withType(JavaCompile) {
  options.compilerArgs += ['--add-exports=java.base/jdk.internal.vm=ALL-UNNAMED', '--enable-preview']
}
tasks.withType(JavaExec) {
  jvmArgs += ['--add-exports=java.base/jdk.internal.vm=ALL-UNNAMED', '--enable-preview']
}
JIT - Just In Time compilation
The JVM will monitor which branches of code are run the most often, the methods or parts of methods, specifically loops are executed the most frequently.
Code execution could speed up if that method/part of method was compiled to native machine code and JVM can do so using Just in Time compilation.
So part of our application is being run
- in interpreted mode as bytecode (less frequently used code) and
- some is running as compiled native machine code (most frequently used).
Code will generally run faster, the longer it is left to run.
That’s because the virtual machine can profile your code and work out, automatically, which bits of it could be optimized by compiling them to native machine code.
Compiler Flags
-XX:+PrintCompilation - provides insight into the compilation process of
methods by the JVM, including information about their optimization levels and
status
java -XX:+PrintCompilation Main.java
Section of the output
50   31     n 0       java.lang.System::arraycopy (native)   (static)
56   19       3       java.lang.Integer::valueOf (32 bytes)
56   20       3       java.lang.Number::<init> (5 bytes)
56   21       3       java.lang.Integer::<init> (10 bytes)
57   23 %     4       nitin.performance.PrimeNumbers::isPrime @ 2 (35 bytes)
57   22       1       java.util.ArrayList::size (5 bytes)
57   24       3       nitin.performance.PrimeNumbers::getNextPrimeAbove (40 bytes)
58   23       3       java.util.ImmutableCollections$SetN$SetNIterator::hasNext (13 bytes)   made not entrant
1043  779   !   3       com.sun.tools.javac.jvm.PoolReader$ImmutablePoolHelper::readIfNeeded (148 bytes)   made not entrant
-
column 1is time in milliseconds since the VM Started -
column 2is the order in which the method or the code block is complied -
!means exception -
nmeans Native method -
smeans it’s a synchronized method -
%the code has been natively compiled and is now running from * *code-cache** for optimal performance- most optimized way possible
- Next column is
1,2,3,4indicates Compilation level (C1 -> Native Level 1,2,3&C2 -> Native Level 4) -
made not entrant: This message typically appears when a compiled method is invalidated due to changes in the execution profile or other factors.- When a method is “not entrant,” it means that it is no longer considered suitable for execution, and the JVM may de-optimize it or recompile it with different optimizations.
C1 and C2 compilers
The HotSpot virtual machine (since Java version 1.3) contains two conventional JIT-compilers:
The client compiler, also called C1 produces Native Level 1,2,3
- C1 is designed to run faster and produce less optimized code,
- is a better fit for desktop applications, since its faster
the server compiler, called opto or C2 produces Native Level 4
- C2 takes a little more time to run but produces a better-optimized code.
- C2 has been extremely optimized and produces code that can compete with C++
- is better for long-running server applications that can spend more time on the JIT compilation
Tiered Compilation
The default strategy used by the HotSpot is called tiered compilation.
Tiered Compilation is a strategy used by the HotSpot JVM (Java Virtual Machine) for optimizing Java bytecode into native machine code.
Interpreted Mode: When a Java program starts its execution, the bytecode generated by the javac compiler is initially interpreted by the JVM. This interpretation is slower compared to executing native machine code directly.
Method Profiling: The JVM keeps track of methods that are frequently called during execution. These methods are candidates for compilation because compiling them into native code can significantly improve performance.
C1 Compilation: The JVM uses the C1 compiler (also known as the client compiler) to compile frequently called methods. The C1 compiler is designed for quick compilation but produces less optimized code compared to the C2 compiler.
Method Profiling Continued: Even after compiling methods with the C1 compiler, the JVM continues to monitor method invocations. If certain methods continue to be heavily used, the JVM may decide to recompile them using the C2 compiler.
C2 Compilation: The C2 compiler (also known as the server compiler) is a more advanced compiler that produces highly optimized native code. It takes more time to compile compared to the C1 compiler but produces faster code.
Optimization Levels: Both C1 and C2 compilers have multiple optimization levels. The JVM may choose different optimization levels based on the frequency and importance of the methods being compiled.
Control Options
-client: This option instructs the JVM to use the client compiler (C1) as the
default compiler. Prevent’s C2 compiler to kick in if needed.
It’s typically used for client-side applications where startup time is critical,
and the highest level of optimization is not necessary.
-server: This option instructs the JVM to use the server compiler (C2) as the
default compiler.
It’s suitable for server-side applications where maximum performance is desired,
and startup time is less critical.
-d64: This option specifies that the JVM should run in 64-bit mode, utilizing
the larger address space available on 64-bit architectures.
-XX:-TieredCompilation: This option disables tiered compilation, meaning that
only the C2 compiler will be used.
This can be useful for debugging or performance analysis purposes, where you
want to focus exclusively on the behavior of the C2 compiler.
In summary, Tiered Compilation is a dynamic compilation strategy used by the HotSpot JVM to balance between quick startup times and optimal runtime performance by utilizing both the C1 and C2 compilers based on method usage patterns. Control options allow developers to customize the compilation behavior based on their specific requirements.
Native Compilation tuning
java -XX:+PrintFlagsFinal
Check the following flags
-
CICompilerCount- how many threads are available to run the compiling process -
CompileThreshold- the number of times a method/code needs to run before it is natively compiled
bool C1ProfileVirtualCalls                    = true                                   {C2 product} {default}
bool C1UpdateMethodData                       = true                                   {C2 product} {default}
intx CICompilerCount                          = 12                                        {product} {ergonomic}
bool CICompilerCountPerCPU                    = true                                      {product} {default}
intx CompileThreshold                         = 10000                                  {pd product} {default}
The same can be found out using jinfo
Run the jps command to see the java processes
jps
11440 GradleDaemon
1692 Main
17342 Jps
Check jshdb jinfo vs jinfo
jinfo --flag CICompilerCount 1692
-XX:CICompilerCount=n
-XX:CompileThreshold=n
Profiling the code
The virtual machine decides which level of compilation to apply to a particular block of code based on how often it is being run and how complex or time-consuming it is.
The higher the number, the more profiled the code has been.
If the code has been called enough times, then we reach level four and the C2 compiler has been used instead. And this means that our code is even more optimized than when it was compiled using the C1 compiler.
Tuning the code cache
-XX:+PrintCodeCache
If the code cache is full, the warning message is
code cache is full, compiler has been disabled.
CodeHeap 'non-profiled nmethods': size=119168Kb used=12Kb max_used=12Kb free=119155Kb
 bounds [0x0000000121fe8000, 0x0000000122258000, 0x0000000129448000]

CodeHeap 'profiled nmethods': size=119164Kb used=34Kb max_used=34Kb free=119129Kb
 bounds [0x000000011a448000, 0x000000011a6b8000, 0x00000001218a7000]

CodeHeap 'non-nmethods': size=7428Kb used=1152Kb max_used=1169Kb free=6275Kb
 bounds [0x00000001218a7000, 0x0000000121b17000, 0x0000000121fe8000]

total_blobs=332 nmethods=33 adapters=206

compilation: enabled
stopped_count=0, restarted_count=0 full_count=0
We can change the code cache size with three different flags.
InitialCodeCacheSize is the size of the code cache when the application
starts.
The default size varies based on available memory, but it’s often around about
160kB.
ReservedCodeCacheSize is the maximum size of the code cache. In other words,
the code cache can grow over time
up to the size of the reserved code cache.
CodeCacheExpansionSize dictates how quickly the code cache should grow as it
gets full. How much extra space should be
added each time the code cache is grown
Example
java -XX:ReservedCodeCacheSize=150M -XX:+PrintCodeCache RunProgram

CodeCache: size=153600Kb used=1197Kb max_used=1211Kb free=152402Kb
 bounds [0x0000000113d48000, 0x0000000113fb8000, 0x000000011d348000]
 total_blobs=330 nmethods=31 adapters=206
 compilation: enabled

stopped_count=0, restarted_count=0 full_count=0
Remotely manage codeCache using Jconsole
From local JConsole installation, invoke the jconsole
cd /usr/bin
jconsole
2024-02-10 00:16:58.371 jconsole[16258:688137] WARNING: Secure coding is not enabled for restorable state! Enable secure coding by implementing NSApplicationDelegate.applicationSupportsSecureRestorableState: and returning YES.
Choose the Remote process and provide appropriate parameters


32 bit JVM vs 64 bit JVM
| 32 bit JVM | 64 bit JVM |
|---|---|
| Might be faster if heapSize < 3GB | Might be faster if heavy use of longs & doubles |
| Max Heap Size = 4GB | Max Heap size - OS Dependent - Necessary if heap > 4GB |
| Client compiler Only (C1, Faster) | Client & Server Compilers (C1 & C2) |
Based around the fact that each pointer to an object in memory will be smaller with 32 bit size pointer and manipulating these pointers will be quicker, the smaller applications might run faster on 32 bit machines than on 64.
The important point here is that for smaller applications, don’t just pick the 64 bit version of the Java virtual machine First, test the performance on both 32 bit and 64 bit JVM.
You might find you get better performance with the 32 bit JVM in case you’re interested.
Tuning JVM Flags
String Pool is implements using a hashmap
A hash code is calculated by JVM and the string is put into the map
A standard hash map starts with just 16 buckets, but it grows over time.
-XX:+PrintStringTableStatistics
-XX:StringTableSize=120120
-XX:MaxHeapSize=1g OR -Xmx1g
-XX:InitialHeapSize=4g OR -Xms4g
-XX:+UnlockDiagnosticVMOptions
-XX:+PrintFlagsFinal
-XX:+PrintStringTableStatistics -XX:StringTableSize=999999 -Xmx1g -Xms4g
StringTable statistics:
Number of buckets       :     65536 =    524288 bytes, each 8
Number of entries       :         7 =       112 bytes, each 16
Number of literals      :         7 =       488 bytes, avg  69.000
Total footprint         :           =    524888 bytes
Average bucket size     :     0.000
Variance of bucket size :     0.000
Std. dev. of bucket size:     0.010
Maximum bucket size     :         1

Shared String Table statistics:
Number of buckets       :      1920
Number of entries       :      7438
Maximum bucket size     :        11
-XX:+HeapDumpOnOutOfMemoryError
-XX:HeapDumpPath=<>
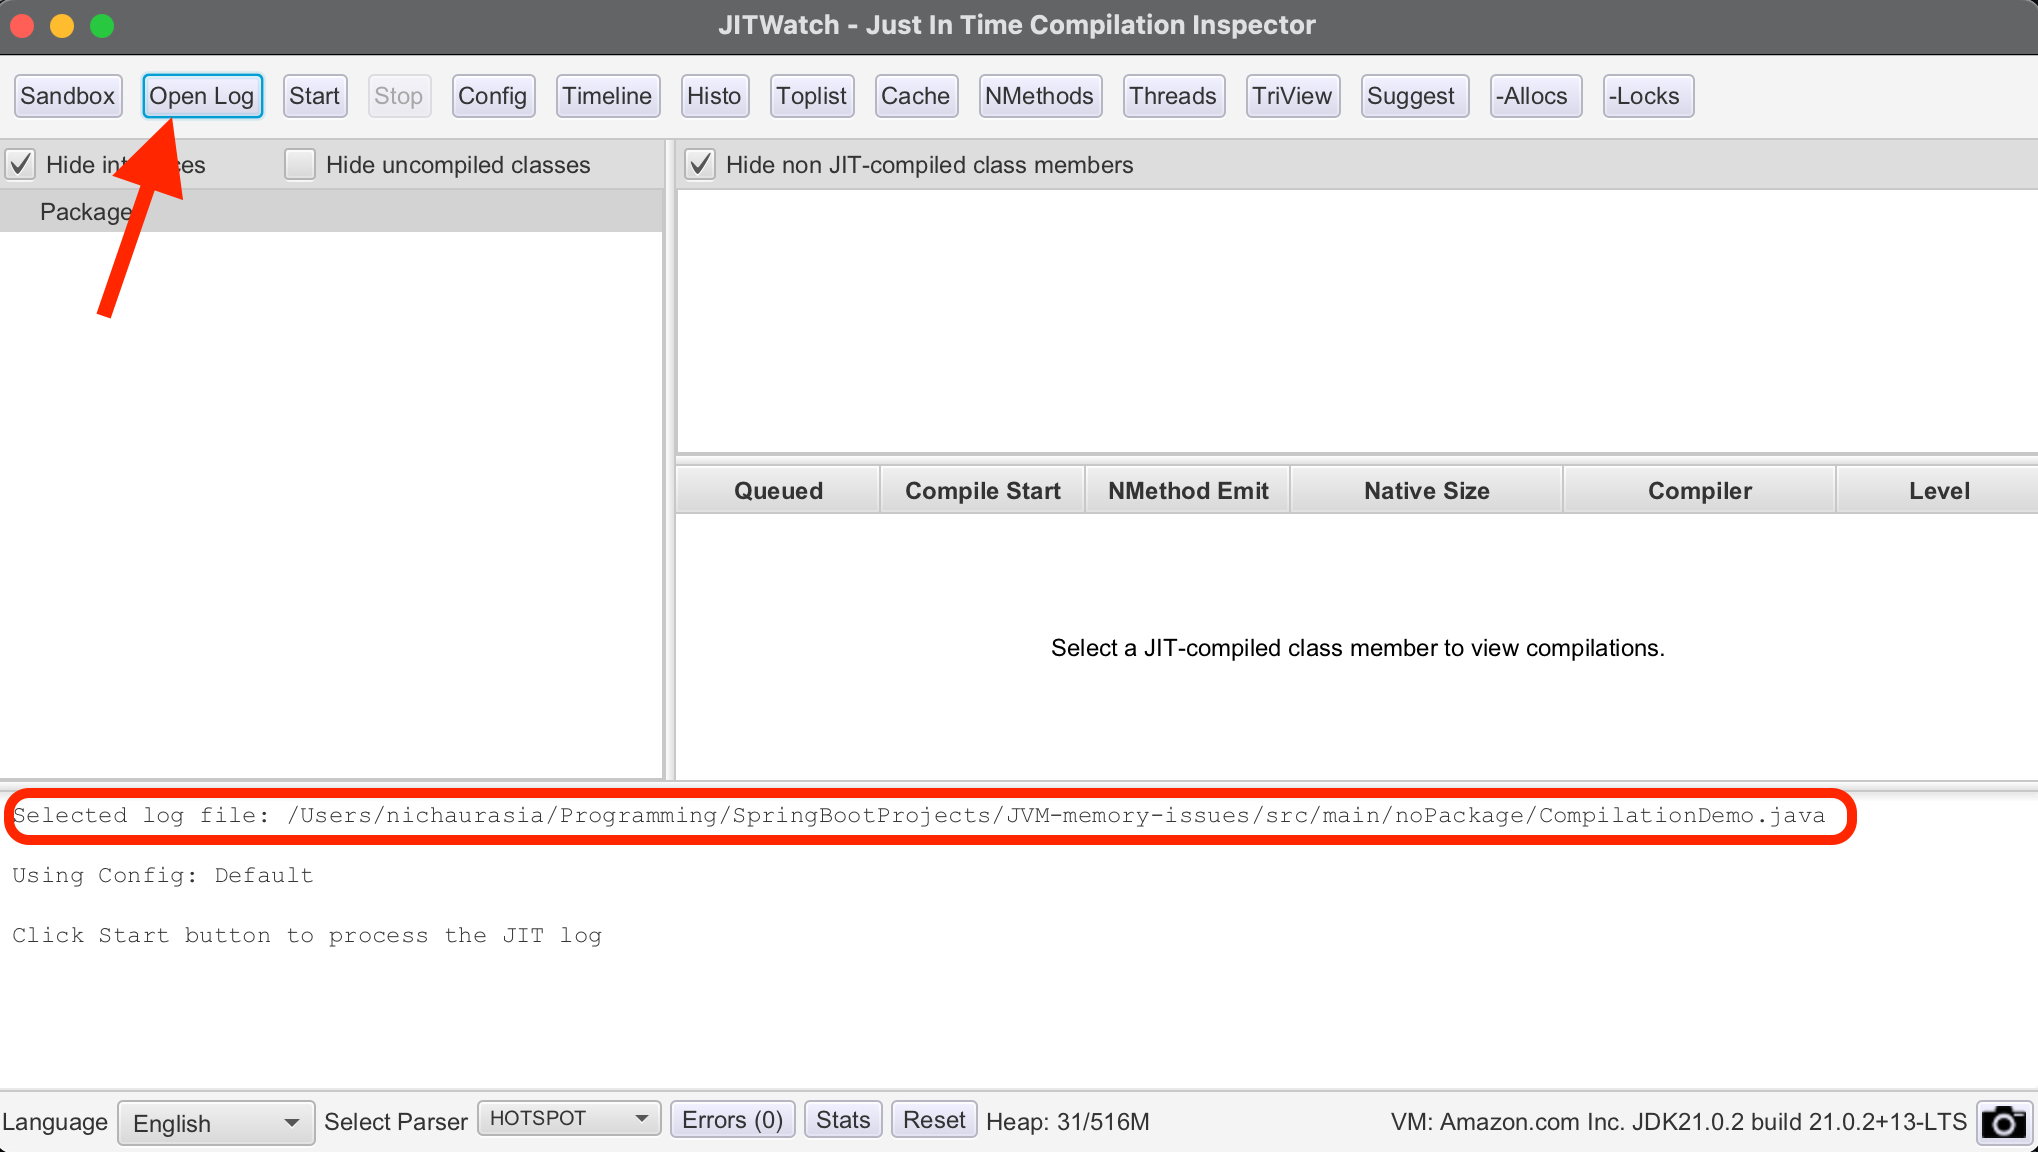
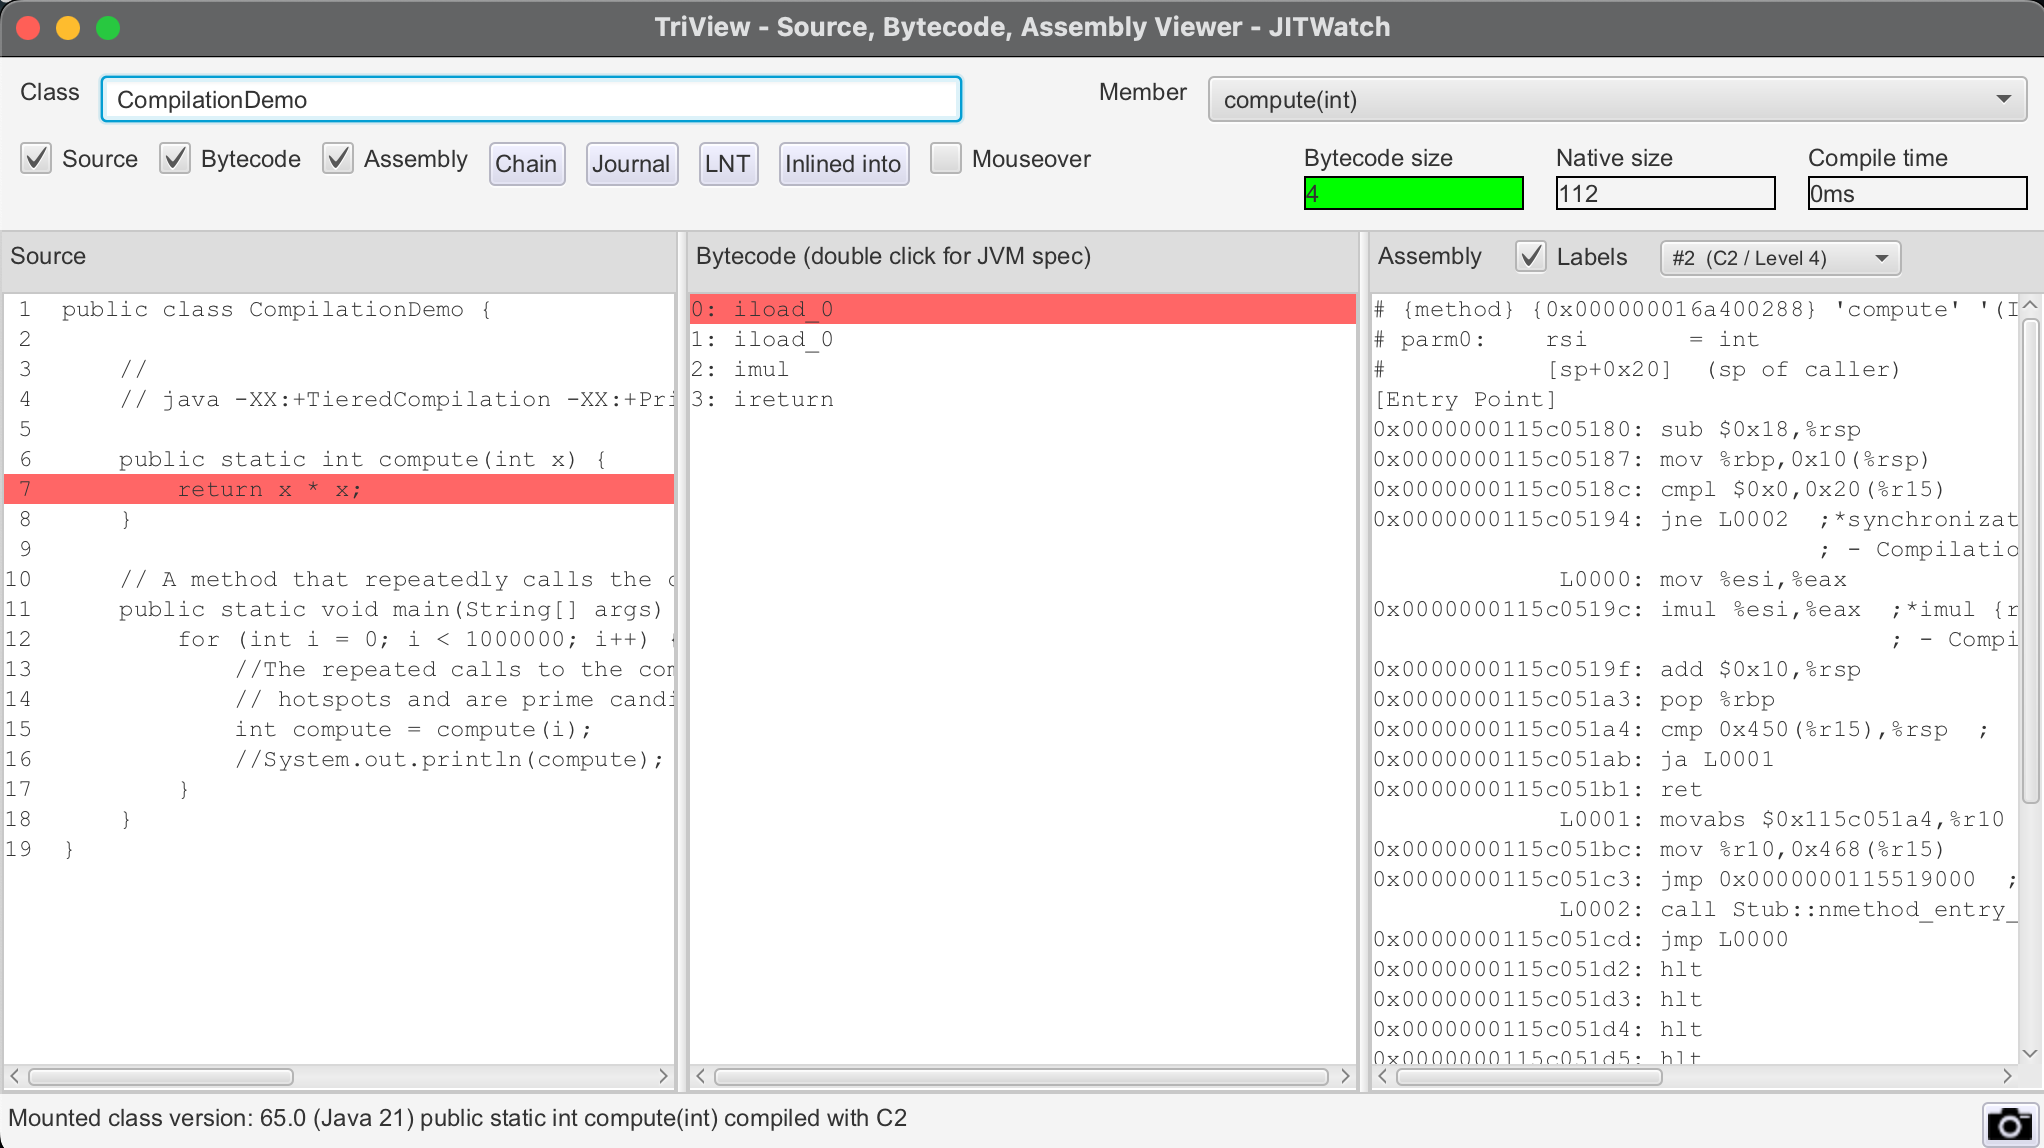
JIT Watch - Compiler inspector
git clone https://github.com/AdoptOpenJDK/jitwatch.git

cd jitwatch
mvn clean package && java -jar ui/target/jitwatch-ui-shaded.jar